Transformer Logistics Monitoring - Shock and Impact Recorder
Introduction
This paper has been written with a purpose to assist manufacturers, transporters and all those who are concerned with the transportation of Transformers. The paper will help one to understand the problems faced during Transformer logistics, their outcomes and the reason for their occurrences. The various solutions to reduce transit risk have also been discussed.
This paper briefly provides you an idea about the level of shocks a transformer shipment experiences in different modes of transportation, recording them using a shock recorder and analysis of shock data.
Power Transformers are usually very reliable, but when faults occur, they can be affected catastrophically. During transportation if a Transformer experiences a mechanical shock more than the suggested “g” levels the following damage may occur:
- Windings/core may get displaced or distorted.
- Due to active part movement, the insulation between the turns can be abraded, causing a short circuit and damage to the windings later during operation.
- Mechanical vibrations may cause the windings to loose their clamping pressure, eventually leading to collapse of the windings during electric faults.
- The safe clearance between the tank and the active part may be compromised.
We can sum up all these key issues as:
- Visible Damage: Leading to on site or factory repairs
- Concealed Damage: Causing out of warranty failure
During Loading, Unloading and Rigging: Generally low occurrence but with potential of high magnitude impact (like lifting gear failure, dropped Transformer). Shock events from 2.5 to 10.0 g in 2-20 Hz band are experienced.
Impacts Onboard a Trailer: Transformers are subjected to impacts in longitudinal axis during braking operations and vertical and lateral shocks due to road conditions. Normally acceleration from 0.5 to 1.0 g in 3-350 Hz band is experienced.
Impacts Onboard a Ship: Rolling, Pitching and Yawing; low frequency vibrations repeating at regular periods. Normally acceleration from 0.3 to 0.8 g in 2-30 Hz band is experienced.
Impacts onboard Rail: Transformers are subjected to impacts in longitudinal axis during shunting operations and vertical shocks due to rail joints. Normally acceleration from 0.5 to 1.0 g in 2-500 Hz band is experienced, but during shunting operation acceleration up to 4.0g in 2-20 Hz band can be experienced.
Tests Suggested to Check Against Damages
Standard Tests Performed Upon Arrival
1. Visual Inspection for external damages, positive nitrogen pressure and dew point check.
2. Shock recorder data analysis to ascertain concealed damage:
o Amplitude of shock
o Frequency analysis of shock as per DIN EN 13011 to estimate the damage potential of shock
3. Magnetic Balance Test
4. Earth to Winding Capacitance Test
5. Core Ground (Meggar)
6. Bushing Capacitance and Power Factor
7. SFRA (Sweep Frequency Response Analysis)
Tests listed from 3 to 7 are useful only when compared with factory tests carried out before dispatch of Transformers.
Standard Tests Prior Energizing the Transformer
The tests to be performed prior to energizing are:
1. Test fiber optic temperature probe before oil filling.
2. Tests after Oil Filling:
a. Power Factor & Capacitance
b. Meggar (including core ground)
c. FRA
d. TTR
e. Fiber Optic Temperature Probes
f. 10kV Excitation Test
3. Final Checks:
g. Full oil screen meets C57.106
h. Total dissolved gas < 0.50%
i. System protection verifications
Mechanical Shock and Damages
An event which damages the Transformers due to excessive and sudden acceleration shall be called mechanical shock or impact. A shock is characterized by the maximum value of the occurring acceleration or deceleration and by duration. This can best be seen in Figure 1 of acceleration plotted over time t, the acceleration scale is in units of “g” where g=9.8m/s2.
During the impact, acceleration increases, reaches a maximum value and then decreases again. If an elastic body such as a Transformer hits a hard surface with a certain initial impact velocity, its motion will not come to a sudden standstill owing to the elastic properties of the Transformers but continue for some milliseconds. As the Transformer is slowed down over an extended time interval, shock pulse dampens. The damage is caused by the half sine portion of the shock pulse that has maximum amplitude (Marked as a dotted line in Figure 1).
If, however, a small hard steel ball hits the same wall at the same initial impact velocity, the impact duration will be considerably shorter, but maximum acceleration will also be greater (Green curve in Figure 1). This means that for the same impact energy a smaller mass produces higher amplitude acceleration and shorter time period or higher frequency (f=1/T). This is why large power transformers (>100T) get damaged between the 2.5 to 5.0 g (2-20 HZ) band, while a small equipment like a laptop gets damaged between 37 to 50 g (2-250Hz) band.
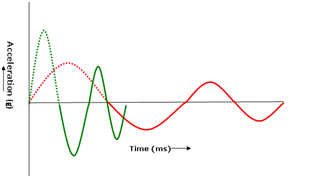
Figure 1: Mechanical Shock Pulse
Damage caused by mechanical shock:
- Mechanical damage concealed or visible
- Geometrical distortion of winding/core
- Loss of coil clamping pressure
- Loss of Nitrogen gas pressure due to leaks
- Damage to accessories like radiators, bushing etc
Vibrations and Damages
Vibrations are periodical oscillatory movements initiated by the most diverse causes. In transport practice there are no vibrations that consist only of a single frequency. The complex transportation environment always results in a frequency composition (frequency spectrum) with individual frequencies having different amplitudes. In road transport the frequencies that occur are between 3 and 350 Hz, on ships, however, they are only between 2 and 33 Hz. Vibrations are capable of exciting resonance vibrations or co-vibrations in other potentially vibrating bodies like Transformers. Resonance vibrations are generated if the natural frequency of a body (e.g. a Transformer) coincides with a frequency of the inducing vibration and this induced vibration has sufficiently large amplitude. The body’s natural frequency depends on its material properties such as mass and modulus of elasticity. The resonance frequency can be excited to such an extent that destruction of the system ensues (resonance catastrophe).
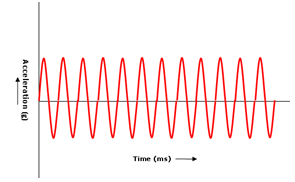
Figure 2: Vibration Pulse
Vibration can cause following damages:
- Loose Components
- Hardening of Metals
- Micro Cracks
Basics of Mechanical Shock Pulses
Mechanical shock pulses are sinusoidal waves. The damage potential of the shock pulse depends upon its:
- Peak Amplitude
- Waveform
The peak amplitude in measures in units of “g” where g= 9.8m/s2.
The waveform is described in three ways; any one can be adopted for transformers:
- Frequency
- Duration
- Velocity Change (ΔV)
Frequency describes the time as compared to cycles per second and the unit of measure is called Hertz (Hz). Duration describes the time as compared to seconds and the usual unit of measure is milliseconds (ms). The mathematical expressions related to these two terms are:
Duration = (1 / Frequency) / 2
Frequency = (1 / Duration) / 2
The Figure 3 shows the shock wave or an impact wave in time domain. The wave is a sine curve with acceleration in g (g=9.8m/s²) along the y axis and time in ms along the x axis.
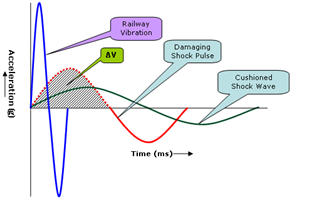
Figure 3: Shock pulse compared
There are two parts of a shock which can cause damage, the acceleration amplitude and the velocity change (ΔV). The velocity change, or the area under the acceleration time history of the shock, can be thought of as the energy contained in a shock. The higher the velocity changes the higher the energy content. There is a minimum velocity change which must be achieved before damage to the Transformer can occur. This level is called the critical velocity change. Below the critical velocity change, no damage occurs regardless of the input acceleration level. In essence, there is not enough energy in the shock to cause harm to the Transformer. Exceeding the critical velocity change, however, does not necessarily imply that damage results. If the change in velocity occurs in a manner which administers acceptable doses of acceleration to the product, the velocity change can be very large with out causing damage. However, if the critical velocity and the critical acceleration are both exceeded, damage occurs.
In Figure 3, Normal railway vibration blue wave of 2000g @0.1ms (amplitude=2000g & Duration=0.1 ms Frequency: 500Hz) is not at all damaging since the critical ΔV is not reached, whereas as a drop from few inches (Depending on the transformer weight, volume and nature of impact surface) may produce a shock of 7g@50ms red wave (amplitude=7g & Duration=50ms Frequency: 10Hz) and will damage the Transformer. So amplitude is not the only determining factor for damage but also the duration or frequency of the pulse. These two when together specified as the damage limit for a product is called NOSS (Non Operating Shock Specification). The fragility or NOSS of the Transformers should be specified in either of the formats:
1. In terms of critical amplitude and duration (Eg. 7g@50ms)
OR
2. In terms of critical amplitude and frequency (Eg. 7g@10Hz)
OR
3. In terms of critical amplitude and critical velocity change (ΔV) (Eg. 7g @2.18 m/s) *
The damage potential of the shock can also be analyzed using the following frequency transformation of the shock wave:
- FFT: Fast Fourier Transformation
- PSD: Power Spectral Density
Estimation of Transformer Fragility
The Transformer fragility is dependent on its material properties, mass, volume and design. Due to Transformer size and monetary value it is impossible to establish their fragility using standard drop or shock table tests. The fragility can be theoretically calculated by Shock Response Spectrum (SRS) analysis using analysis software or in even more detail using FEA analysis.
The best practical way of estimating transformer fragility is to analyze the historical records of impact record data in co relation with the damage that might have occurred during earlier shipments. Maintain a historical co relation table between shock and actual damage for different transformer design (MVA) or weight.
A general guideline based on empirical results, for transformer fragility (amplitude and ΔV) as a function of its weight is:
|
Weight of transformer (T) |
Fragility level (g@20Hz) |
ΔV (Velocity change) (m/s) |
|
Up to 10 T |
9 |
1.40 |
|
10-50 T |
6 |
0.94 |
|
50-100 T |
5 |
0.78 |
|
100-200 T |
3 |
0.47 |
|
200-300 T |
2.5 |
0.39 |
|
>300 T |
2 |
0.31 |
Impact recorders should measure accelerations in three axes, with a recommended range of 0g to 10g. Impacts that exceed design criteria in any of the three axes may cause damage. Depending upon the design criteria, consider longitudinal impacts above 5g and between 2-20 Hz as rough handling.
Impact or Shock Recorders
Impact recorders are equipments that log shock value and the time it occurred. Impact recorders are used to monitor shipments where concealed damage is a key concern like Transformers. The purpose of using Impact Recorders for monitoring Transformers is:
1. Determine any shock that may have caused a concealed damage.
2. Use the data to substantiate any insurance claims, as these recorders log the time of any impact that might have caused damage. The most modern loggers also allow location and data monitoring remotely.
3. To reduce warranty claims that may occur later during operation due to shock damage during Transportation. Usually this occurs due to concealed damage going unnoticed. Though this should be covered under transit insurance the cost is born by the Transformer manufacturer under warranty due to lack of proper use of impact recorders.
4. The data collected over time can be used to empirically calculate Transformer fragility or improve Transformer designs.
5. To form the first line of test to decide on whether more expensive tests like FRA should be done at site or not.
Impact Recorder Types
There are two types of Impact Recorders:
- Electromechanical Impact Recorders
- Electronic Impact Recorders, which are further categorized as:
- Peak Acceleration Impact Recorders
- Waveform Impact Recorders
Electromechanical Impact Recorders
These are the earliest shock recorders that were used by the Transformer industry. They consist of a sensor attached to a mechanical recording arm which registers the shock event on a moving paper chart.
Pros
– Have been used for a long time
– Widely understood
Cons
– Paper jam or running out of paper
– Long length of paper to inspect and possible human error while interpreting data
– The data can be tampered with easily
– Difficulty in determining the date/time when impact occurred
– The data cannot be used for detailed frequency analysis to determine if damage has occurred or not.
Electronic Impact Recorders
The electronic impact recorders are of two types:
- Peak Acceleration Recorders
- Waveform Recorders
The peak acceleration recorders only record the amplitude of the shock and not the waveform. Though they are less costly as compared to waveform recorders, the data captured by these recorders cannot be used for further frequency analysis to determine Transformer damage.
The waveform recorders record impacts above the threshold defined by the user (usually the transformer critical acceleration) in form of digital graphs. These graphs can be further analyzed in time or frequency domain to determine the potential of the shock to damage the Transformer.
The following points should be taken care of when choosing the shock recorders for Transformers; if these are not followed the use of recorders becomes a useless effort and does not provide sufficient data to estimate the Transformer damage:
1. The recorder should be a waveform recorder so that the data can be used to estimate both amplitude and frequency of the shock.
2. The recorder software should analyze the shock data in frequency domain as per DIN EN 13011.
3. The battery life should be minimum 3 months so that the recording can be done during the complete shipment duration
4. The recorder should provide an up gradable option to attach external GPS/GPRS device for tracking of transformers and remote monitoring of shock data. This acts like a physiological deterrent against mishandling.
Pros
– Impact data stored electronically in memory
– No moving parts to break or fail
– Date and Time stamps for each major event
– Improved accuracy, usually within +/- 2%
– Instant verification if recorder is working and if it has exceeded preset thresholds
– Record multiple distinct events that occur consecutively and the exact times
– Detailed event data which is very easy to understand and can be further analyzed for damage potential.
– Long life, give a good ROI
– Additional device like GPS can be integrate for tracking
Cons
– Require training to properly set-up device
– Potential loss of complete data on electronic failure
Impact Recorder Data Analysis
Data analysis can be done in two ways
- Time Domain Analysis
- Frequency Domain Analysis
Time Domain Analysis
1. Analyzing shock amplitude and duration/frequency:
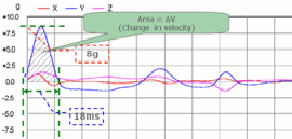
Figure 4: Impact recorded by an electronic impact recorder
Amplitude (a) = 8g
Duration (t) = 18ms or .018s
Frequency (1/2t) = 1/ (2 * 0.018) = 28 Hz
Shock of: 8g@18ms or 8g@28Hz
For the shock to damage a transformer the following should be simultaneously reached:
- The peak acceleration should exceed the critical acceleration.
- The duration of the peak half sine curve should exceed the critical shock duration OR the frequency should be lower than the critical frequency.
Example: Let’s take a hypothetical case of a transformer for which the fragility or NOSS is estimated as 7g@50ms or 7g@10HZ. The impact recorder attached to this transformer recorded a shock as shown in figure 4. As we can see in the analysis done earlier the shock has a peak acceleration of 8g and a corresponding duration of 18ms or frequency 28Hz. The peak acceleration 8g is higher than the transformer critical acceleration of 7g. The duration of the peak acceleration is less than critical duration of 50ms. If we analyze in terms of frequency the shock frequency of 28HZ is more than the critical frequency of 10HZ. Since both the condition of critical acceleration and duration/frequency was not been violated simultaneously the shock will not damage the transformer, even though when the peak acceleration is more that the critical acceleration.
2. Analyzing shock amplitude and velocity change:
The data can also be analyzed in terms of peak acceleration and critical velocity change. The method is the most accurate but is a little difficult to use as compared to the earlier method and requires software tools to analyze raw data accurately. For the shock to damage a transformer the following should be simultaneously reached:
- The peak acceleration should exceed the critical acceleration.
- The velocity change corresponding to the peak acceleration should exceed critical velocity change for the Transformer
In the Figure 4 the progression of a mechanical shock wave is represented in time domain. The energy transferred to the Transformer during the impact can be calculated using the formulae:

Where:
m: Mass of the Transformer
?v: Velocity Change (Area under the peak acceleration half sine curve)
The energy in the Transformer is converted to ductility and heat. In practice mixed forms consisting of elastic and inelastic impacts arise. In these cases the progression in time of the acceleration can often be described approximately with the first half cycle of a sinusoidal oscillation. Consequently

Where:
t: Duration of shock wave
a: Peak acceleration
This applies for the impact velocity, i.e. the decisive energy for the destruction by shock is proportional to the square of the product of the maximum acceleration “a” and shock time “t”. This product “ta” with the dimension of "velocity" is also known as the shock force.
The maximum acting force is, on the other hand, in accordance with Newton's Law equal to the product of the maximum acceleration and mass.

Where:
m: Transformer mass
a: Peak acceleration
This force can be used to calculate dynamic loading on different components during design phase.
Limitations of Time Domain Analysis
- Noise data can’t be easily distinguished from actual data.
- Aliased shock waves can’t be distinguished aliasing refers to an effect that causes different continuous signals to become indistinguishable (or aliases of one another) when sampled. It also refers to distortion or artifacts that result when a signal is sampled and reconstructed as an alias of the original signal. So in this case the distorted data recorded by the recorder when analyzed may lead to false estimation of potential damage.
Frequency Domain Analysis
The raw vibration data recorded by the impact recorder can also be evaluated for damage potential in the frequency domain. The two methods used are:
- Fast Fourier Transformation (FFT)
- Power Spectral Density (PSD)
Fast Fourier Transformation (FFT) analysis: This mathematical method is used to analyze the raw data, i.e. the given frequency spectrum for its frequency composition. The transformation visualizes the frequencies that occur in the course of acceleration over time. Physically speaking, this means that the data are transformed from time space into frequency space. The acceleration ‘g’ levels in the relevant frequency space can be compared with Transformer NOSS. E.g. If the Transformer NOSS was 5g@20HZ we should compared it with the amplitude of shock in frequency band of 0-20 HZ in the FFT curve (Curve: Amplitude Vs Frequency).
The fast Fourier transform (FFT) is a discrete Fourier transform algorithm which reduces the number of computations needed for N points from 2N2 to 2N lg N, where “lg” is the base-2 logarithm. If the function to be transformed is not harmonically related to the sampling frequency, the response of an FFT looks like asinc function (although the integrated power is still correct). Aliasing (leakage) can be reduced by apodization using a tapering function. However, aliasing reduction is at the expense of broadening the spectral response. The output of FFT transformation on an amplitude versus time curve (Figure 5) is an amplitude versus frequency curve (Figure 6). The frequency analysis is best performed using the recorder software.
The power spectral density (PSD), describes how the power (or variance) of a time series is distributed with frequency. Mathematically, it is defined as the Fourier Transform of the autocorrelation sequence of the time series. An equivalent definition of PSD is the squared modulus of the Fourier transform of the time series, scaled by a proper constant term.
Being power per unit of frequency, the dimensions are those of a power divided by Hertz.
Figure 5 shows the raw data collected by the shock recorder on a Transformer shipment. It shows the acceleration amplitude over time. Figure 6 visualizes the frequency spectrum obtained from the data by using FFT. To be able to make good use of these data for damage potential, the FFT data are used to generate a PSD spectrum as shown in Figure 7. It can be clearly seen that the analyzed vibration has frequency components between 10 and 20 Hz that have a high power density and therefore a great potential for damage.

Figure 5: Raw time domain data Recorded
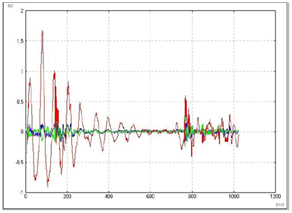
Figure 6: FFT- Fast Fourier Transformation
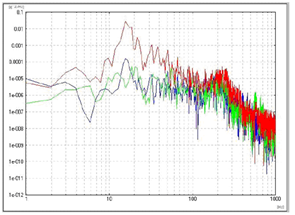
Figure 7: PSD- Power Spectral Density
Shipping Care
1. Manufacture Transformers to withstand reasonable shipping forces expected for shipment.
2. FOB site or foundation should be clear in supply contract. Most accidents occur during shifting of Transformer to its foundation.
3. Find suitable impact recorders, ones that give waveform data and have frequency analysis as per DIN EN 13011 are the ones to be used for power Transformers. Set them appropriately as per Transformer NOSS; and mount them as low as possible on a rigid location. IEEE guidelines PC57.150 recommend using two recorders per Transformer to eliminate chances of loss of data due to impact recorder failure. Such recorders should be mounted on diagonally opposite positions for best results.
4. For further consideration and in their own interest:
– The Transformer manufacturer to do capacitance measurements, FRA on HV side, Earth to Winding Capacitance tests so as to compare with the test done at site.
– Loss measurements on each tap to ensure the tap connections are made up properly or not
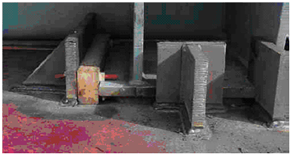
5. Increased internal bracing between the tank and active part frame.
6. Additional support for the core from the frame.
7. Desiccant should be there inside tank as to maintain the state of dryness.
8. Adding to the shipping systems
Use of special damping dunnage between Transformer and bracing
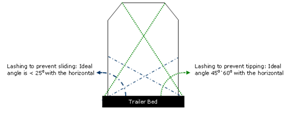
Use of proper lashing, refer to the IMO lashing code or AAR lashing guidelines. The following diagram shows a good cross lashing arrangement:
9. At least one dry air bottle must be there with the shipment
Ask your Logistics Company or rigger to take care of the following transportation restrictions:
1. Proper consideration of SRT (Static Roll Threshold) reduces the risk of overturning. Refer to local guidelines on SRT. Special consideration should be given to SRT when shipping to New Zealand.
2. Axle load distribution.
3. Brake force distribution between tractor and trailer should be as per trailer manufacturer guidelines.
4. Maintain proper ratio between the gross mass of the trailer and tractor.
5. The vehicle must adhere to the designated route and not travel on a road if fog, heavy rain, hail or any other such factor restricts ambient visibility to less than 500 m.
6. Local transportation regulations should be adhered to and large power Transformers should use hydraulic trailers.
7. Actual survey of the planned route should be carried out.
8. Permissions must be there to travel on particular road or highway.
Acknowledgement
The authors gratefully acknowledge the contributions of Indian Transformer Industry for contribution on this document.
References
- Heavy hauling, transportation and rigging guidelines for power Transformers, WG for transportation issues guide (IEEE PC57.150)
- Transportation Issues of Power Transformers - Willy Hoffmann, Tom Lundquist, Ewald Schweiger and Manuel Silvestre, IEEE
- An Assessment of the Common Carrier Shipping Environment - Forest Products Laboratory Technical Report FPL22
- Swedish, Finnish, New Zealand and Norwegian national road regulations
- IMO: International Maritime Organization
- American Rail Road Regulations
- DIN 30787 Part 5
- MIL-STD 810 F, April 1997
- DIN 55439 Part 2 Page 3 July 1981
- DIN 55439 Part 2 Page 6 July 1981
- ASTM D3332
- DIN EN 13011
0 Comments
leave a comment